
Page 18 - Transitioning Turfgrass
P. 18
TRANSITIONING TURFGRASS
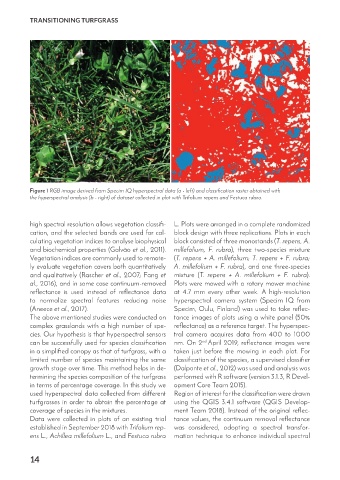
Figure 1 RGB image derived from Specim IQ hyperspectral data (a - left) and classification raster obtained with
the hyperspectral analysis (b - right) of dataset collected in plot with Trifolium repens and Festuca rubra.
high spectral resolution allows vegetation classifi- L. Plots were arranged in a complete randomized
cation, and the selected bands are used for cal- block design with three replications. Plots in each
culating vegetation indices to analyse biophysical block consisted of three monostands (T. repens, A.
and biochemical properties (Galvão et al., 2011). millefolium, F. rubra), three two-species mixture
Vegetation indices are commonly used to remote- (T. repens + A. millefolium; T. repens + F. rubra;
ly evaluate vegetation covers both quantitatively A. millefolium + F. rubra), and one three-species
and qualitatively (Rascher et al., 2007; Fang et mixture (T. repens + A. millefolium + F. rubra).
al., 2016), and in some case continuum-removed Plots were mowed with a rotary mower machine
reflectance is used instead of reflectance data at 4.7 mm every other week. A high-resolution
to normalize spectral features reducing noise hyperspectral camera system (Specim IQ from
(Aneece et al., 2017). Specim, Oulu, Finland) was used to take reflec-
The above mentioned studies were conducted on tance images of plots using a white panel (50%
complex grasslands with a high number of spe- reflectance) as a reference target. The hyperspec-
cies. Our hypothesis is that hyperspectral sensors tral camera acquires data from 400 to 1000
can be successfully used for species classification nm. On 2 April 2019, reflectance images were
nd
in a simplified canopy as that of turfgrass, with a taken just before the mowing in each plot. For
limited number of species maintaining the same classification of the species, a supervised classifier
growth stage over time. This method helps in de- (Dalponte et al., 2012) was used and analysis was
termining the species composition of the turfgrass performed with R software (version 3.1.3, R Devel-
in terms of percentage coverage. In this study we opment Core Team 2015).
used hyperspectral data collected from different Region of interest for the classification were drawn
turfgrasses in order to obtain the percentage at using the QGIS 3.4.1 software (QGIS Develop-
coverage of species in the mixtures. ment Team 2018). Instead of the original reflec-
Data were collected in plots of an existing trial tance values, the continuum removal reflectance
established in September 2018 with Trifolium rep- was considered, adopting a spectral transfor-
ens L., Achillea millefolium L., and Festuca rubra mation technique to enhance individual spectral
14