
Page 19 - Transitioning Turfgrass
P. 19
th
6 ETS Field Days
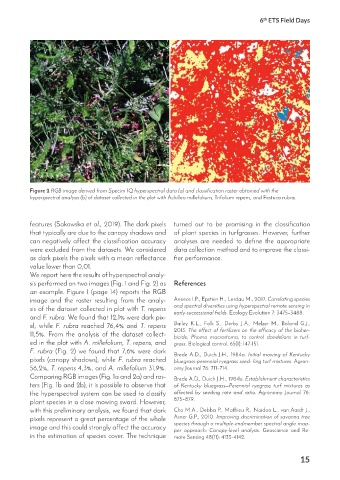
Figure 2 RGB image derived from Specim IQ hyperspectral data (a) and classification raster obtained with the
hyperspectral analysis (b) of dataset collected in the plot with Achillea millefolium, Trifolium repens, and Festuca rubra.
features (Sakowska et al., 2019). The dark pixels turned out to be promising in the classification
that typically are due to the canopy shadows and of plant species in turfgrasses. However, further
can negatively affect the classification accuracy analyses are needed to define the appropriate
were excluded from the datasets. We considered data collection method and to improve the classi-
as dark pixels the pixels with a mean reflectance fier performance.
value lower than 0,01.
We report here the results of hyperspectral analy-
sis performed on two images (Fig. 1 and Fig. 2) as References
an example. Figure 1 (page 14) reports the RGB
image and the raster resulting from the analy- Aneece I.P., Epstein H., Lerdau M., 2017. Correlating species
sis of the dataset collected in plot with T. repens and spectral diversities using hyperspectral remote sensing in
early-successional fields. Ecology Evolution 7: 3475–3488.
and F. rubra. We found that 12,1% were dark pix-
el, while F. rubra reached 76,4% and T. repens Bailey K.L., Falk S., Derby J.A., Melzer M., Boland G.J.,
11,5%. From the analysis of the dataset collect- 2013. The effect of fertilizers on the efficacy of the bioher-
bicide, Phoma macrostoma, to control dandelions in turf-
ed in the plot with A. millefolium, T. repens, and grass. Biological control. 65(1): 147-151.
F. rubra (Fig. 2) we found that 7,6% were dark Brede A.D., Duich J.H., 1984a. Initial mowing of Kentucky
pixels (canopy shadows), while F. rubra reached bluegrass-perennial ryegrass seed- ling turf mixtures. Agron-
56,2%, T. repens 4,3%, and A. millefolium 31,9%. omy Journal 76: 711–714.
Comparing RGB images (Fig. 1a and 2a) and ras- Brede A.D., Duich J.H., 1984b. Establishment characteristics
ters (Fig. 1b and 2b), it is possible to observe that of Kentucky bluegrass—Perennial ryegrass turf mixtures as
the hyperspectral system can be used to classify affected by seeding rate and ratio. Agronomy Journal 76:
plant species in a close mowing sward. However, 875–879.
with this preliminary analysis, we found that dark Cho M.A., Debba P., Mathieu R., Naidoo L., van Aardt J.,
pixels represent a great percentage of the whole Asner G.P., 2010. Improving discrimination of savanna tree
image and this could strongly affect the accuracy species through a multiple-endmember spectral angle map-
per approach: Canopy-level analysis. Geoscience and Re-
in the estimation of species cover. The technique mote Sensing 48(11): 4133-4142.
15